You are now leaving Meeder Investment Management. Links to other websites are provided for your convenience and information only. When you click on a link to another website you will be leaving this website. The fact that Meeder Investment Management provides links to other websites does not mean that we endorse, authorize or sponsor the linked website, or that we are affiliated with that website’s owners or sponsors. This material is being provided for informational purposes only and is not a solicitation or an offer to buy any security or to participate in any planning or investment strategy. Unless otherwise indicated, the linked sites are not under our control and we are not responsible for and assume no liability for the content or presentation of any linked site or any link contained in a linked site, or any changes or updates to such sites. We make no representations about the accuracy or completeness of the information contained in any linked sites and their privacy and security policies may differ from ours. We recommend that you review this third-party’s policies and terms carefully.

The U.S. labor market remains tight and is seemingly unfazed by the headwinds of higher interest rates. September’s nonfarm payrolls report of 336,000 jobs easily exceeded analysts’ expectations of 227,000. According to the Bureau of Labor Statistics, the labor force participation rate remained unchanged at 62.8% and is at its highest level since February 2020. September’s unemployment level also remained steady from August at 3.8%.
The credit agency provided two positive factors that justified its stable outlook for the United States. The U.S. maintains the world’s most powerful economy, with an output of more than $20 trillion in GDP. The second factor is that the U.S. dollar remains the world’s primary reserve currency. This status allows the U.S. government exceptional flexibility to finance its activities.
to provide mixed performance results in the third quarter. Companies that were larger and more growth-oriented provided stronger results than those that were smaller and more value-oriented. Volatility increased throughout the quarter but remained below its long-term average.
Investors in the Meeder Growth Strategy have captured much of the upside of the stock market’s year-to-date performance despite near-continual headlines surrounding inflation and the Federal Reserve. Investors who remained invested in portfolios employing the Growth Strategy in the third quarter experienced more volatility in our suite of risk-based portfolios.
We began the third quarter with a target equity exposure of 90%. The short-term model score was strong as all ten trend and momentum indicators in the IPS model were positive. Meanwhile, the long-term model score weakened as elevated valuations in the U.S. equity market weighed on the long-term model’s score.
Near the end of July, the Federal Reserve announced it would raise interest rates by 0.25% to its highest level in over 20 years after seeing stronger-than-expected economic growth. The number of advancing vs. declining stocks reached extremely bullish levels as more than 1.7 times as many advancing as declining stocks. Near this time, the long-term model score weakened as inflation and elevated valuations remained a focus for investors.
In early August, market risk levels increased when Fitch Ratings downgraded the U.S. government’s credit rating from AAA to AA+ due to concerns about the country’s rising debt load. The long-term model score deteriorated because of elevated valuations, inflationary pressures, and weakening market breadth. The intermediate-term model score strengthened as a resurgence in bearish investor sentiment occurred, which we view from a contrarian perspective. The short-term model score softened in August but remained additive, as 7 of 10 trend and momentum indicators were positive. The extreme improvement in the intermediate-term model score offset the weakening in the long and short-term model scores, and the combination of these model changes resulted in keeping the net equity exposure at 90% through the end of the third quarter.
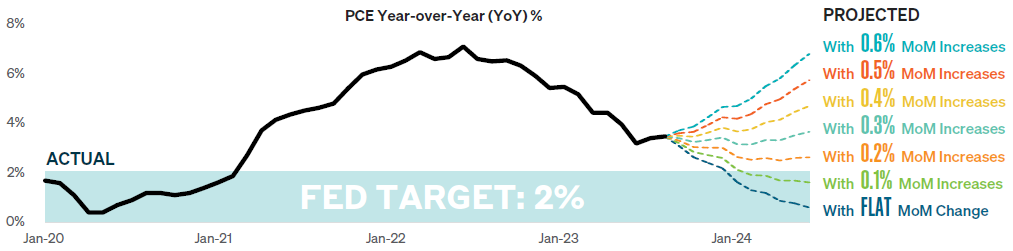
Interest rates surged during the third quarter, with the U.S. 10-year Treasury yield increasing from 3.8% to above 4.8% in early October. While economic data was very strong during the quarter and inflation remained above the Fed’s long-term goal of 2%, the “higher for longer’ narrative firmly took stage as risky assets experienced negative returns. While investment-grade bonds experienced losses during the month of September, short-duration U.S. Treasuries generated gains of more than 1% during the month and U.S. high yield finished just above breakeven.
The duration of the Tactical fixed-income strategy remained shorter than its respective benchmark, finishing the month of October with an effective duration of less than three years. This positioning was a positive contributor to its relative performance during September. The strategy also employed an overweight to U.S. high yield and increased exposure to this fixed-income sector during the first week of September. On a relative basis, this high yield position positively contributed to the strategy relative to holding U.S. investment grade bonds, which was more negatively impacted by the surge in interest rates toward the end of the third quarter.
©2023 Meeder Investment Management, Inc.
0107-MIM-10/16/23-37207