You are now leaving Meeder Investment Management. Links to other websites are provided for your convenience and information only. When you click on a link to another website you will be leaving this website. The fact that Meeder Investment Management provides links to other websites does not mean that we endorse, authorize or sponsor the linked website, or that we are affiliated with that website’s owners or sponsors. This material is being provided for informational purposes only and is not a solicitation or an offer to buy any security or to participate in any planning or investment strategy. Unless otherwise indicated, the linked sites are not under our control and we are not responsible for and assume no liability for the content or presentation of any linked site or any link contained in a linked site, or any changes or updates to such sites. We make no representations about the accuracy or completeness of the information contained in any linked sites and their privacy and security policies may differ from ours. We recommend that you review this third-party’s policies and terms carefully.

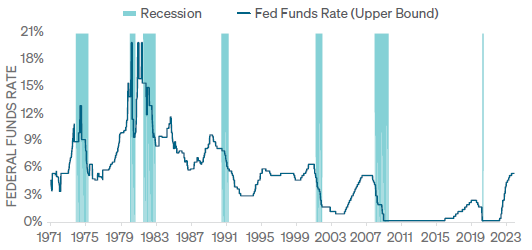
One significant problem is that the Fed has only accomplished a soft landing twice in nine rising-rate cycles since 1970. At the December FOMC meeting, Powell admitted that the committee does not have a good track record in orchestrating soft economic landings. Exhibit 2 plots the upper bound of the Fed Funds rate since 1970 and shows both the expansionary and recessionary periods. The illustration shows that historically, the Fed typically begins cutting interest rates but fails to lower them quickly and substantially enough before the economy enters a recession.
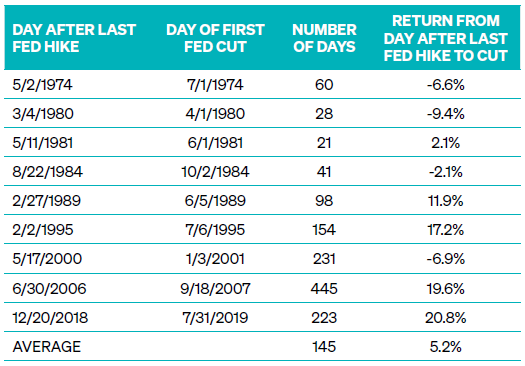
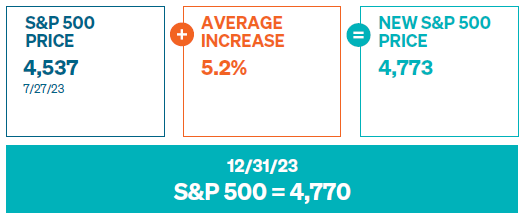
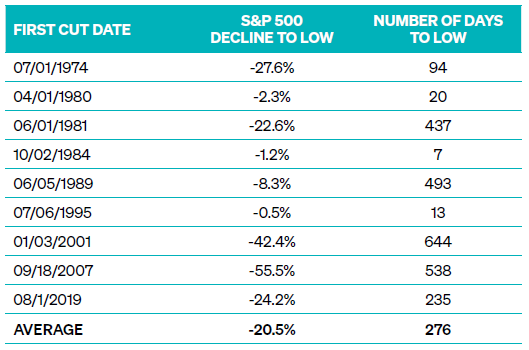
One common perception among investors is that the stock market performs well as soon as the Fed starts cutting interest rates. History tells us this is not necessarily the case.
In fact, Exhibit 5 shows over the past nine initial interest rate cuts, more than half of the Fed’s first cuts were followed by declines in the S&P 500 Index that ranged from -22.6% to -55.5%. The Technology bubble in the early 2000s and the Great Financial Crisis proved to be the worst scenarios, with the Fed cutting interest rates at two different times during the secular bear market of 2000–2009.
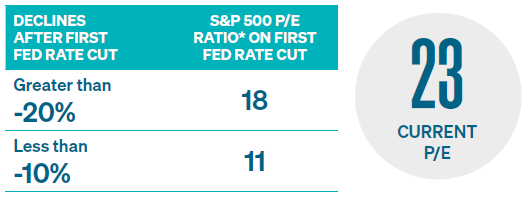
While the market has experienced both bull and bear markets following the first Fed rate cut, history does not indicate that the Fed’s accommodative policy will carry the market higher. Valuations matter, too. Exhibit 6 illustrates that when the market experienced a decline of at least -20 % after the Fed’s first cut, the average S&P 500 trailing PE ratio was 18. On the other hand, when the S&P 500 had a decline of less than -10 %, the average PE ratio was 11.4. The current P/E ratio of 23 could be another reason to be more cautious once the Fed makes its first cut.
GROWTH STRATEGY
Investment portfolios utilizing the Meeder Growth Strategy maintain a more aggressive objective and typically remain invested in the stock market.
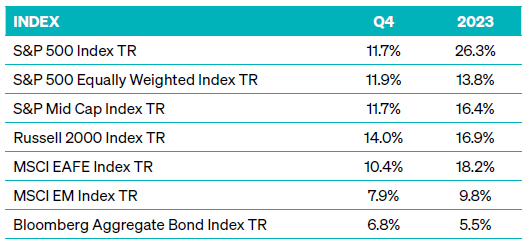
The S&P 500 Index climbed nearly 10% in the fourth quarter, bringing the 2023 return above 26%. Growth-oriented stocks continued outperforming their value-oriented peers, with large-cap stocks posting the best performance in 2023 of the market capitalizations. After experiencing negative performance year-to-date through October 27, 2023, small-cap stocks rallied after lower-than-expected inflation data boosted confidence. This data result shifted the Fed’s outlook from a potential rate hike to possible rate cuts in 2024. Investors in portfolios employing the Growth Strategy experienced more volatility in the fourth quarter than others in our suite of risk-based portfolios. However, those who remained invested earned some of the highest performance.
DEFENSIVE EQUITY STRATEGY
Portfolios that utilize the Meeder Defensive Equity Strategy follow a quantitative rules-based and data-driven approach using the Meeder Investment Positioning System (IPS) model. This investment model determines the risk relative to the reward present in the marketplace and identifies when we should increase or decrease the portfolio’s target equity exposure.
We began the quarter with 90% exposure to stocks. The Israel-Hamas war caused geopolitical tensions to rise, and equity market risk increased. The long-term model score was
cautious as a combination of higher interest rates and above-average inflation results challenged the equity market. By the end of October, the long-term model score turned negative, led by a combination of weak industry market breadth and worsening leading economic indicators. Equity market risk remained above its 10-year average and posed challenges for equities. The long-term model score was cautious as above-average inflation and elevated valuations remained headwinds for equity markets. These model factors guided us to reduce our equity exposure down to 77% near the end of October.
With the S&P 500 Index nearly 7% above its October low, we continued to see improvement in the short-term model score. Equity market risk fell drastically, with the VIX dropping from 21.7 in mid-October to 15 in early November. This improvement led us to increase our equity exposure to 87% shortly after mid-November. Market expectations of Fed policy turned accommodative after downward trending inflation reports and weakening job data. This data led to optimism within the intermediate-term model. The S&P 500 climbed more than 8% in November, and market breadth increased with an average of 1.5x more advancing stocks than declining stocks in November. This equity strength and improving market breadth led to all trend and momentum indicators turning positive. The short-term model score significantly increased and caused us to extend our equity exposure to 90% to begin December.
By the middle of December, an increase in expectations that the Fed will begin cutting interest rates in the first half of 2024 strengthened the intermediate-term model score to climb near one of its best readings in history. The improvement in investor sentiment led to growing demand for U.S. small- and mid-cap stocks, pushing market breadth higher. The VIX fell below 12.5 for the first time in almost four years. The combination of these strengthening factors caused us to increase our equity exposure to 95%.
FIXED INCOME STRATEGY
The Meeder Fixed Income Strategy tactically shifts portfolio exposure utilizing our proprietary investment models. These models actively monitor economic and market-related factors to guide us in determining the credit quality, emerging market debt exposure, and the portfolio’s U.S. Treasury duration.
It was a seesaw fourth quarter for the bond market. Interest rates rose rapidly during October, with the U.S. 10-year Treasury yield rising from 4.59% at the end of the third quarter to 5.0% by the end of the month. In November, yields declined rapidly– from near 5.0% to 3.88% at the end of the quarter– as expectations for further Fed rate hikes
disappeared from the marketplace and investors began pricing in Fed rate cuts. Disinflationary economic data was the key driver leading the bond market rally during the quarter. Investment grade fixed income rose 6.82%, and high-yield bonds rose 7.16% during the quarter.
The duration of the Tactical fixed-income strategy remained shorter than its respective benchmark, finishing the month of December with an effective duration of less than three years; however, the duration was increased during the quarter to take advantage of rising bond market yields in October and then reduced again after the rally. This positioning was a positive contributor to its relative performance during the quarter. The strategy also maintained an overweight to U.S. high yield and increased exposure to this sector during December. On a relative basis, this high-yield position positively contributed to the strategy’s performance.
©2024 Meeder Investment Management, Inc.
0107-MIM-1/17/24-39264