Equity Exposure
It’s your future.
We’ll navigate,
you drive.
The Meeder Investment Positioning System (IPS) guides the Drive investment process for certain Meeder Funds.
Just as a navigation system or GPS operates in a vehicle, the Meeder IPS is designed to help investors get to their destination with less risk and greater confidence. Using a proprietary, model-driven, multi-discipline, multi-factor approach, Meeder IPS constantly monitors investment opportunities and risk and suggests a favorable route based on current market conditions.
Take a deeper look


How Drive Works
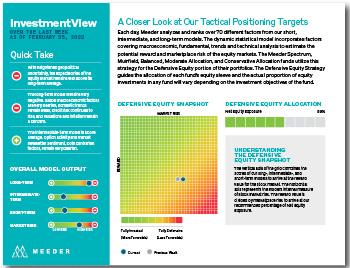
The Meeder IPS guides the Drive investment process with a focus on optimizing investor outcomes. The Meeder IPS uses a quantitative model to evaluate over 70 separate factors each day in order to calculate the reward value of the equity markets. Based on years of research and development, Meeder’s proprietary tactical allocation model calculates the Reward Value of the market based on factors that have historically signaled market direction. The Reward Value is then divided by the current Market Risk to determine the appropriate level of equity exposure.

Reviews 70+ factors daily
Over 70 separate factors reviewed each day to calculate the Reward Value of the equity markets.

Determines appropriate equity exposure
Reward Value is divided by the current Market Risk to determine the appropriate level of equity exposure.

Makes risk-mitigating adjustments
Based on market conditions, the IPS will increase or decrease exposure to equities to reduce the risk in the portfolio.

Our Process
At Meeder, we offer tactical asset allocation portfolios that are designed to minimize volatility by reducing our exposure to the stock market in high-risk market environments and increasing our exposure in lower-risk market environments. We do this by making data driven decisions to keep clients from getting caught in the cycle of emotions. By reducing our exposure to the stock market in more severe market declines while still providing the opportunity for growth, we help keep clients committed to their investment strategy throughout a full market cycle.
How Meeder Funds Leverage Drive
Meeder’s Drive investment process is utilized in part to guide the equity allocation of the following Meeder Funds. Within our asset allocation funds, Drive only guides the portion of a fund’s portfolio that is allocated to equity securities. In those funds, an Equity Exposure Gauge reading of 100% indicates that 100% of the equity portion of the fund’s portfolio is invested in equities.
| Funds | Price | YTD | 1 Year | 3 Year | 5 Year | 10 Year | Fund Lifetime | Lifetime Date |
|---|---|---|---|---|---|---|---|---|
| Asset Allocation Funds | ||||||||
The performance data shown represents past performance, which does not guarantee future results. The investment return and principal value of an investment will fluctuate so that an investor’s shares, when redeemed, may be worth more or less than their original cost. Current performance may be lower or higher than the performance data quoted.
Mutual fund investing involves risk. Principal loss is possible. Investors are advised to consider carefully the investment objectives, risks, charges and expenses of the fund before investing. The prospectus contains this and other information about the funds. Contact us at the address below to request a free copy of the prospectus. Please read the prospectus carefully before investing.
Each of Meeder’s asset allocation funds can scale back their equity exposure in order to reduce risk of loss when the Adviser’s quantitative models indicate that the risks of the stock market may be greater than its potential rewards. The Adviser’s models may prove to be incorrect or incomplete and there is a risk that the model will either overstate or understate current risks in the market. Asset allocation and diversification do not assure a profit or protect against loss.
The Funds use equity index futures to equitize cash, to reduce equity exposure and as an element of the principal investment strategy for some funds. Using leverage through futures can magnify the Funds’ gains or losses. Use of derivative instruments as a defensive tactic may provide the funds with a hedge against losses, but would also prevent the Funds from fully participating in market gain. Derivatives are not suitable for all investors and subject the Funds to greater risk than investment in fixed income assets.
Investment performance assumes reinvestment of all dividend and capital gain distributions. Returns for less than one year are not annualized. Performance data may reflect the effect of voluntary fee waivers or expense reimbursements that may change or end at any time. Institutional and Adviser Class share performance reflects Retail Class performance prior to the creation of those share classes. For additional information refer to the individual fund page or the current prospectus.
The gross expense ratio reflects the total fund operating expense ratio gross of any fee waivers or expense reimbursements as set forth in the current prospectus. The net expense ratio is the audited ratio of net expenses to average net assets as set forth in the fund’s most recent annual report, which may include the effect of voluntary fee waivers or expense reimbursements.
Net Equity Exposure represents the current equity exposure recommended by IPS model. The proportion of actual equity investments in any fund will vary depending on the investment objectives of the fund. The model output is updated daily, but may be delayed at Meeder’s sole discretion. Net Equity Exposure represents one output of Meeder’s IPS model at any given point in time; it is not offered as specific investment advice and should not be relied on for investment decisions.
Meeder Funds are distributed by Meeder Distribution Services, Inc., Member FINRA. An affiliated registered investment adviser, Meeder Asset Management, Inc. serves as the investment adviser to the Meeder Funds and is paid a fee for its services.