You are now leaving Meeder Investment Management. Links to other websites are provided for your convenience and information only. When you click on a link to another website you will be leaving this website. The fact that Meeder Investment Management provides links to other websites does not mean that we endorse, authorize or sponsor the linked website, or that we are affiliated with that website’s owners or sponsors. This material is being provided for informational purposes only and is not a solicitation or an offer to buy any security or to participate in any planning or investment strategy. Unless otherwise indicated, the linked sites are not under our control and we are not responsible for and assume no liability for the content or presentation of any linked site or any link contained in a linked site, or any changes or updates to such sites. We make no representations about the accuracy or completeness of the information contained in any linked sites and their privacy and security policies may differ from ours. We recommend that you review this third-party’s policies and terms carefully.

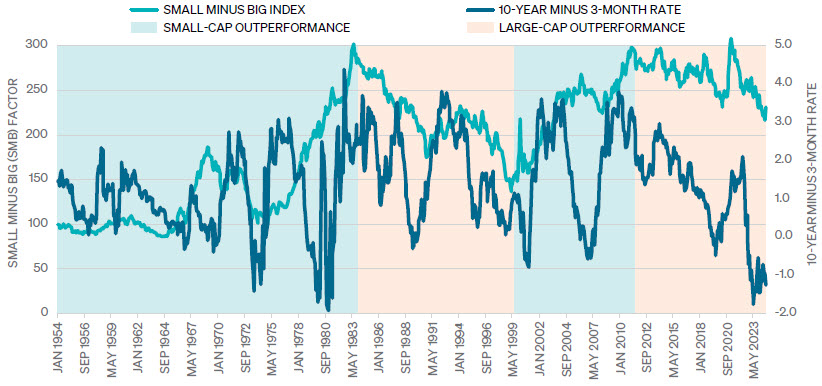
» A steep yield curve has historically led to U.S. small-cap outperformance, while yield curve inversions have been more favorable toward large-cap stocks.
This equal-weighted factor has some benefits over market-cap-weighted indexes like the S&P 500 Index and S&P SmallCap 600 Index. Market cap-weighted indexes allow larger companies to hold significantly more weight, potentially skewing the overall index returns.
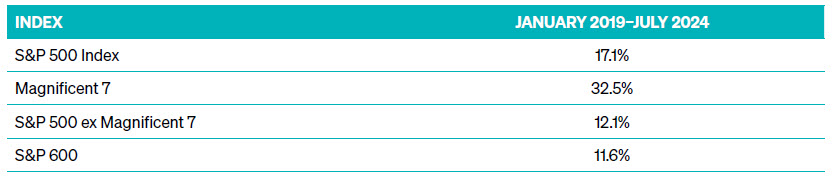
We can analyze the recent impact of the Magnificent 7 stocks on the S&P 500’s performance as an example.* As shown in Exhibit 2, from January 2019–July 2024, the S&P 500 Index outperformed the S&P 600 by 5.5%. During the same period, the Magnificent 7 stocks gained 32.5%. By excluding these 7 stocks from the index, the S&P 500 annualized return drops to 12.1%, only outperforming the S&P 600 by 0.5%. By using the Fama-French Small Minus Big (SMB) factor, we minimize the impact of periods like this on the research.
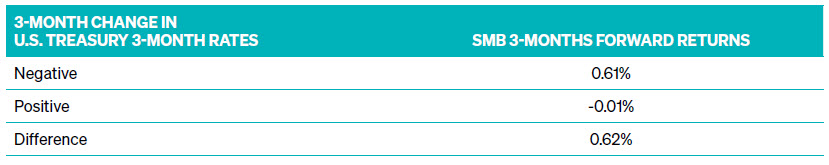
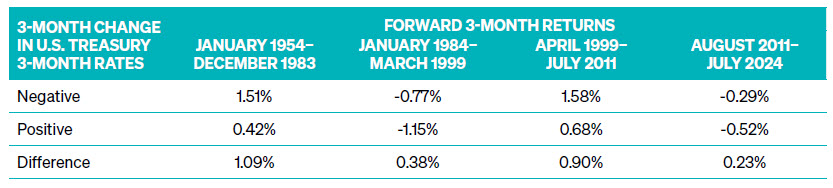
As Exhibit 3 demonstrates, when interest rates declined, forward returns of small-cap stocks were greater than large-cap stocks. When interest rates increased during the previous three months, the forward returns for small-cap stocks were lower than large-cap returns.
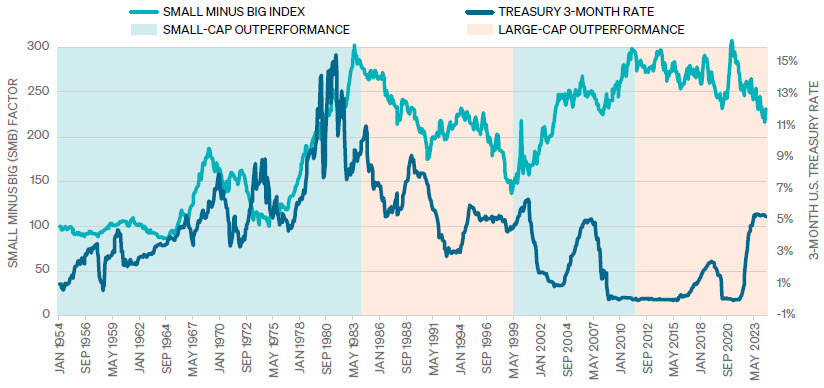
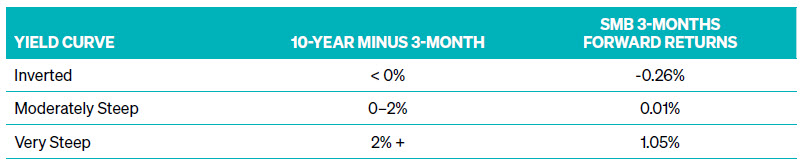
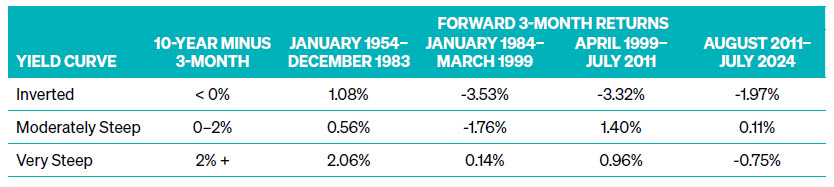
We used the 3-month U.S. treasury bill and the 10-year U.S. treasury bond to define the yield curve. As shown in Exhibit 6, we researched the performance of the small-minus-big factor (SMB) during three scenarios: an inverted yield curve, a moderately steep yield curve, and a very steep yield curve.
Why might this be the case? One reason may be related to company debt. Lower interest rates help small-cap companies reduce interest expenses on new debt and directly lower the cost of their floating-rate debt. Small-cap companies traditionally have weaker balance sheets relative to large-cap companies, so higher debt costs can be especially impactful.
With that being said, the last decade of below-average interest rates have been dominated by large-cap companies investing in e-commerce, new technology, and artificial intelligence. However, when we analyze the performance of stocks by removing the market capitalization bias, small-cap stocks performed better during declining rate environments than rising rate environments. In addition, a positive sloped yield curve often signals optimism about future economic growth. Small-cap companies tend to be more sensitive to economic cycles than large-caps, benefiting more from positive expectations of economic growth.
So, there might be structural changes in the market that can favor either small- or large-cap stocks over a long period, but within these periods the evolving interest rate environment provides opportunities to investors in short- to medium-term to tactically shift assets to small- or large-cap stocks based on the rate environment.
Commentary offered for informational and educational purposes only. Opinions and forecasts regarding markets, securities, products, portfolios, or holdings are given as of the date provided and are subject to change at any time. No offer to sell, solicitation, or recommendation of any security or investment product is intended. Certain information and data has been supplied by unaffiliated third parties as indicated. Although Meeder believes the information is reliable, it cannot warrant the accuracy, timeliness or suitability of the information or materials offered by third parties.
Investment advisory services provided by Meeder Asset Management, Inc.
©2024 Meeder Investment Management, Inc.
0274-MAM-10/28/24-46005