July 2024
Q2 2024 Quarterly Perspectives

Key Takeaways
Quarterly Market Update
The U.S. economy slowed notably in April as GDP for Q1 expanded by only +1.6%. This level was significantly below the anticipated +2.5% and marked a sharp deceleration from the previous quarter’s growth rate of 3.4%. The ISM Manufacturing and Services PMIs fell below the critical threshold of 50, indicating a contraction in economic activity. Despite a strong labor market, the U.S. Nonfarm Payrolls report revealed the addition of 175,000 jobs, falling short of the consensus estimate of 300,000. This level was the lowest monthly job gain in six months, yet it marked the 40th consecutive month of positive employment growth. April’s unemployment rate increased from 3.8% to 3.9%. This string of disappointing data results contributed to April being the worst-performing month of 2024 for many of the market’s major indices.
PERFORMANCE AS OF JUNE 30, 2024
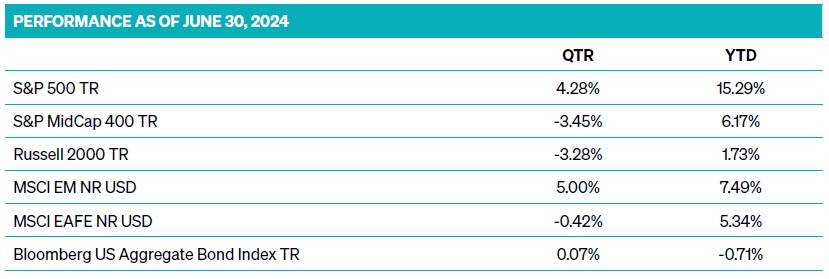
SOURCE: MORNINGSTAR
Markets provided robust performance in May 2024. The Dow Jones Industrial Average closed above 40,000 for the first time on May 16, and the S&P 500 reached a new all-time high of 5,321 just five days later. The S&P 500 surged nearly 5% during the month, pushing its year-to-date gains to over 11%. The Russell 2000 Index also posted a solid return of 5%, turning its year-to-date performance positive. Developed international equities (MSCI EAFE) climbed nearly 4%, bringing their 2024 return to over 7%.
Despite these impressive performance milestones, other economic data remained mixed. Inflation indicators varied, as illustrated in Figure 1. June’s CPI report showed a 3.0% year-over-year increase, while May’s PCE index revealed a +2.7% year-over-year increase. There are significant differences when comparing the weightings between CPI and PCE, which is why the difference in monthly results exists. Figure 2 illustrates these weightings.
Despite these impressive performance milestones, other economic data remained mixed. Inflation indicators varied, as illustrated in Figure 1. June’s CPI report showed a 3.0% year-over-year increase, while May’s PCE index revealed a +2.7% year-over-year increase. There are significant differences when comparing the weightings between CPI and PCE, which is why the difference in monthly results exists. Figure 2 illustrates these weightings.
FIGURE 1: INFLATION DATA INCREASES ODDS OF SEPTEMBER CUT US PCE | Inflation Index YOY % and US CPI Inflation Index YOY% (as of 6/30/2024)
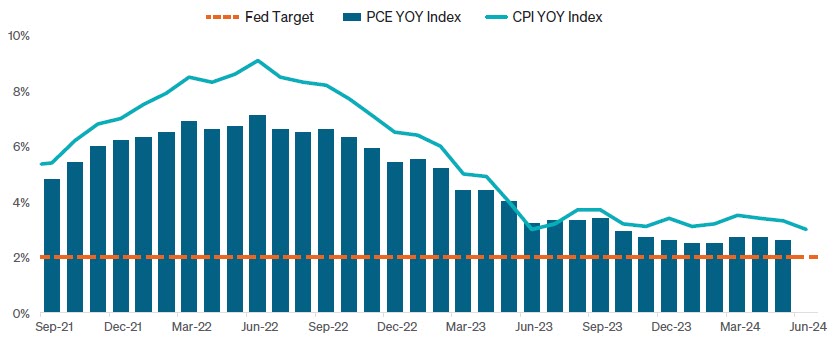
SOURCE: BLOOMBERG
FIGURE 2: WEIGHTING DIFFERENCES OF CPI AND PCE
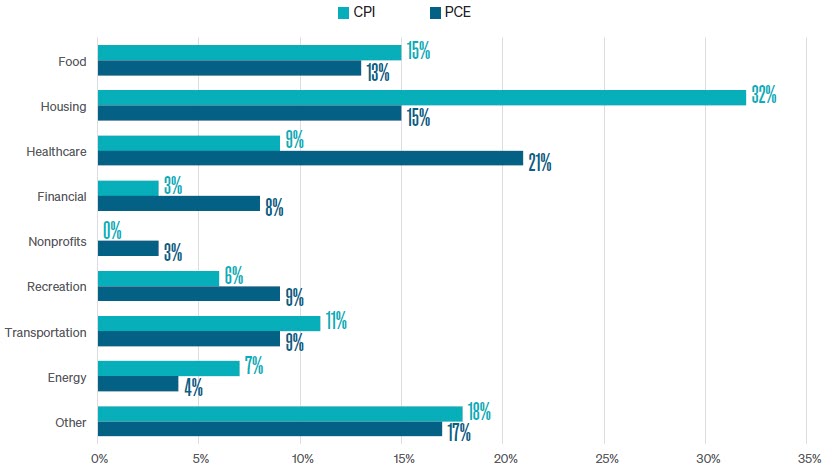
SOURCE: MORNINGSTAR
The Fed favors PCE because it is more comprehensive than CPI and includes spending from rural consumers, not just urban consumers. Additionally, PCE more accurately reflects changes in consumer tastes because its weightings are updated monthly, capturing consumers’ substitution effect, compared to CPI, which rebalances its weighting annually. This disparity between CPI and PCE underscores the complexities of measuring inflation, providing valuable insight into the economic landscape.
In June, the ISM Manufacturing PMI missed expectations with a result of 48.5, and the ISM Services PMI contracted to 48.8, falling short of consensus estimates. Both of these readings fell below 50, signifying a contraction in their respective industries. The labor market remained strong, with nonfarm payrolls increasing by 206,000, surpassing estimates of 190,000. However, U.S. unemployment unexpectedly climbed from 4.0% to 4.1%, marking the highest level since November 2021, as illustrated in Figure 3.
In June, the ISM Manufacturing PMI missed expectations with a result of 48.5, and the ISM Services PMI contracted to 48.8, falling short of consensus estimates. Both of these readings fell below 50, signifying a contraction in their respective industries. The labor market remained strong, with nonfarm payrolls increasing by 206,000, surpassing estimates of 190,000. However, U.S. unemployment unexpectedly climbed from 4.0% to 4.1%, marking the highest level since November 2021, as illustrated in Figure 3.
FIGURE 3: U.S. UNEMPLOYMENT | November 2021–June 2024
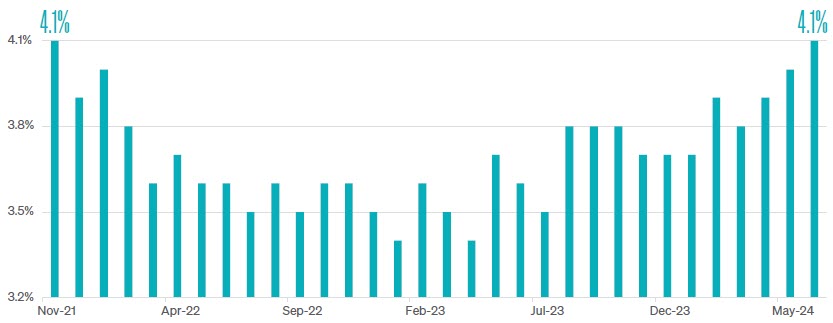
SOURCE: BLS
Despite these uncertainties, market performance in June was robust. Companies focused on Artificial Intelligence’s evolution and business application disproportionately propelled markets higher. The S&P 500 achieved 31 new all-time highs in the first half of 2024. The S&P 500 Index returned +3.59% for the month, contributing to a quarterly gain of +4.3% and a year-to-date increase of +15.3%.
On the other hand, not all stocks benefited from the market’s rising tide, as higher interest rates negatively impacted smaller-cap interest rate-sensitive companies. Investor demand for small and mid-cap companies, as represented by the S&P MidCap 400 and Russell 2000 indices, declined more than
-3% in the second quarter.
Performance in the international markets diverged during the quarter. Emerging market stocks, represented by the MSCI EM Index, increased +5.0%. The performance of developed international stocks in the MSCI EAFE Index struggled and posted a return of -0.42% in the quarter.
The Federal Reserve
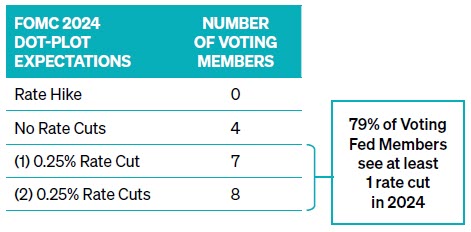
As expected, the Fed held interest rates steady at their June meeting by maintaining the overnight lending range of 5.25%– 5.50%. The most significant development from this meeting was the change in the FOMC’s dot-plot expectations for the remainder of the year. This report shows that fifteen of the nineteen voting members of the FOMC are anticipating at least one rate cut this year, as illustrated in Figure 4. This forecast differed from March when the Fed had anticipated three rate cuts in 2024. Powell stated, “We want to be more confident that inflation is moving sustainably down toward 2% before we start the process of reducing or loosening policy.”
FIGURE 4: 2024 FOMC DOT-PLOT EXPECTATIONS | June 12, 2024
SOURCE: FOMC
Looking Forward
Investors must remain vigilant as we move into the second half of 2024. While the U.S. economy shows signs of slowing, the labor market remains resilient, though it appears to be softening. Inflation indicators continue to present a complex picture, and the Federal Reserve’s cautious stance on interest rates underscores the need for careful monitoring. Investors should remain focused on their long-term goals and be flexible to adapt to evolving market conditions.
How Is This Impacting Portfolios?
Meeder manages investment strategies that utilize a multi-discipline and multi-factor investment approach that guides us in allocating our portfolios. We manage investment solutions across an array of risk profiles and time horizons. Many of these solutions employ one or more of our core investment strategies: Growth, Defensive Equity, and Fixed Income.
GROWTH STRATEGY
Investment portfolios employing the Meeder Growth Strategy maintain a more aggressive objective and typically remain invested in the stock market. The Meeder Growth Strategy
provided substantial upside during the second quarter of 2024, benefiting from the market’s robust performance. The S&P 500 Index reached 31 new all-time highs in the first half of 2024, resulting in a +15.3% total return through June 30. Stocks focused on the creation or application of Artificial Intelligence led the way. Not all stocks benefited from the market’s rising tide as higher interest rates negatively impacted the real estate sector, making it the only S&P sector to experience negative performance through June 30. Market segments that were value-oriented and those that were more sensitive to interest rate changes and economic conditions struggled. Investors in the Meeder Growth Strategy experienced more volatility than other strategies, but those who remained invested achieved the highest returns in our portfolio suite.
provided substantial upside during the second quarter of 2024, benefiting from the market’s robust performance. The S&P 500 Index reached 31 new all-time highs in the first half of 2024, resulting in a +15.3% total return through June 30. Stocks focused on the creation or application of Artificial Intelligence led the way. Not all stocks benefited from the market’s rising tide as higher interest rates negatively impacted the real estate sector, making it the only S&P sector to experience negative performance through June 30. Market segments that were value-oriented and those that were more sensitive to interest rate changes and economic conditions struggled. Investors in the Meeder Growth Strategy experienced more volatility than other strategies, but those who remained invested achieved the highest returns in our portfolio suite.
DEFENSIVE EQUITY STRATEGY
Portfolios utilizing the Meeder Defensive Equity Strategy follow a quantitative, rules-based, and data-driven approach using the Meeder Investment Positioning System (IPS) model. This investment model analyzes risk relative to reward available in the marketplace and identifies when to increase or decrease the portfolio’s target equity exposure.
The strategy began the second quarter with an equity exposure of 96%. Strong positive momentum and trend indicators kept the short-term model score robust despite inflationary pressures pushing the long-term model score into negative territory. Bearish options and fund flows provided a contrarian boost to the intermediate-term model score, reinforcing our cautious yet optimistic stance.
In April, market turbulence did not shake the underlying strength of the short-term model score, which consistently reflected positive trend and momentum factors. Bearish investor sentiment reached a six-month high in the middle of the month, marking a positive contrarian signal for our intermediate-term model, and it led us to increase our equity exposure to 100%.
The short-term model score remained strong in May, driven by robust market breadth and positive trend indicators. A softer than- expected jobs report and increasing expectations of Fed rate cuts in September sustained positive momentum. Significant equity fund outflows provided a positive contrarian signal for the intermediate-term model, while low volatility levels in both equity and bond markets supported a favorable outlook for equities.
June presented a more challenging landscape. The short-term model score remained strong, bolstered by positive market breadth and trend indicators. However, increasing bullish investor sentiment pushed the intermediate-term model score into neutral territory in early June. Reports of softer core CPI and weaker economic data led the market to price in a high likelihood of Fed rate cuts, adding a layer of complexity to our outlook. The combination of these events caused us to reduce our equity exposure to 95% in the middle of June. We further reduced equity exposure to 90% in the third week of June following poor market breadth and elevated valuations. The long-term model score improved in the final week of June as May’s PCE Index met market expectations and market risk declined. The combination of these factors led us to increase our equity exposure to 95% and remain at this allocation through the end of the second quarter.
FIXED INCOME STRATEGY
The Meeder Fixed Income Strategy tactically shifts portfolio exposure utilizing our proprietary investment models. These models actively monitor economic and market-related factors to guide us in determining the allocations of credit quality, emerging market debt exposure, and portfolio duration.
At the beginning of the second quarter, we maintained an overweight position in high-yield relative to investment-grade debt. The forecast for rate cuts kept moving further into the future, limiting the potential for capital appreciation in higher-quality debt. We favored the carry (yield) on high-yield securities. Additionally, we held an overweight position in emerging market debt due to decreasing volatility, a weakening U.S. dollar, and significant price momentum in the sector. Our duration was shorter than the Bloomberg Aggregate Bond index by about one year, given robust growth prospects and reduced expectations for interest rate cuts until at least September.
Increased market volatility and a stronger U.S. dollar weakened our emerging market debt model score, prompting us to sell our position entirely in the third week of April. Near the end of the month, our fixed-income models identified an increase in volatility and rates, leading us to add a position in emerging market debt that was slightly underweight relative to the benchmark. Throughout this period, we maintained a shorter duration stance as the outlook for 2024 rate cuts was extended, with only two cuts expected, beginning in September.
Our stance on emerging market debt shifted to an overweight position by mid-May due to renewed sector momentum, a weakening dollar, and reduced market volatility. We also adjusted our duration strategy to a neutral stance relative to the Bloomberg Aggregate index. This adjustment was in response to downward momentum in yields and the Fed’s indications of no further rate hikes, with two cuts still priced in for the year.
As we moved into late May and throughout June, our overweight position in high-yield remained unchanged due to the continuous delay in rate cuts. We kept our overweight position in emerging market debt, supported by reduced market volatility and sector momentum. Our duration strategy remained neutral, reflecting the ongoing uncertainty in the interest rate path. This uncertainty continued through the end of June when the probability of a rate cut in September increased to roughly 65%. This outlook reaffirmed our neutral stance on duration, and we maintained our overweight allocation in high-yield and emerging market debt as the market navigated these uncertainties. Overall, the fixed income strategy for the second quarter of 2024 maintained a consistent overweight positioning in high-yield and dynamic adjustments in emerging market debt and duration.
The views expressed herein are exclusively those of Meeder Investment Management, Inc., are not offered as investment advice, and should not be construed as a recommendation regarding the suitability of any investment product or strategy for an individual’s particular needs. Investment in securities entails risk, including loss of principal. Asset allocation and diversification do not assure a profit or protect against loss. There can be no assurance that any investment strategy will achieve its objectives, generate positive returns, or avoid losses.
Commentary offered for informational and educational purposes only. Opinions and forecasts regarding markets, securities, products, portfolios, or holdings are given as of the date provided and are subject to change at any time. No offer to sell, solicitation, or recommendation of any security or investment product is intended. Certain information and data has been supplied by unaffiliated third parties as indicated. Although Meeder believes the information is reliable, it cannot warrant the accuracy, timeliness or suitability of the information or materials offered by third parties. Investment advisory services provided by Meeder Asset Management, Inc.
INDEX DESCRIPTIONS
S&P 500 Index: The Index tracks the stock performance of 500 of the largest companies listed on stock exchanges in the United States. It is one of the most followed equity indices and includes approximately 80% of the total market capitalization of U.S. public companies.
S&P 400 MidCap Index: This index serves as a gauge for the U.S. mid-cap equities sector and is the most widely followed mid-cap index. To be included in the index, a stock must have a total market capitalization between $5.8 billion and $15.8 billion.
Russell 2000 Index: The Index is constructed to provide a comprehensive, unbiased barometer of the small-cap segment of the US equity market. A subset of the Russell 3000 Index, it includes approximately 2,000 of the smallest securities based on a combination of their market cap and current index membership.
MSCI EAFE Index: The Index is an equity index that captures large and mid-cap representation across 21 Developed Markets countries around the world, excluding the US and Canada. With 783 constituents, the index covers approximately 85% of the free float-adjusted market capitalization in each country.
MSCI EM Index: The Index captures large and mid-cap representation across 24 Emerging Markets (EM) countries. With 1,440 constituents, the index covers approximately 85% of the free float-adjusted market capitalization in each country.
Bloomberg US Aggregate Bond Index: The Index is a broad-based flagship benchmark that measures the investment-grade, US dollar-denominated, fixed-rate taxable bond market. The index includes Treasuries, government-related and corporate securities, fixed-rate agency MBS, ABS, and CMBS (agency and non-agency). Provided the necessary inclusion rules are met, US Aggregate-eligible securities also contribute to the multi-currency Global Aggregate Index and the US Universal Index. The US Aggregate Index was created in 1986, with history backfilled to January 1, 1976.
©2024 Meeder Investment Management, Inc.
0116-MAM-7/11/24-43322