You are now leaving Meeder Investment Management. Links to other websites are provided for your convenience and information only. When you click on a link to another website you will be leaving this website. The fact that Meeder Investment Management provides links to other websites does not mean that we endorse, authorize or sponsor the linked website, or that we are affiliated with that website’s owners or sponsors. This material is being provided for informational purposes only and is not a solicitation or an offer to buy any security or to participate in any planning or investment strategy. Unless otherwise indicated, the linked sites are not under our control and we are not responsible for and assume no liability for the content or presentation of any linked site or any link contained in a linked site, or any changes or updates to such sites. We make no representations about the accuracy or completeness of the information contained in any linked sites and their privacy and security policies may differ from ours. We recommend that you review this third-party’s policies and terms carefully.

This instability is leading Americans to wonder if this could be the beginning stages of an economic recession. Last quarter’s GDP unexpectedly declined by -1.5%. It is not surprising that with weak economic outlooks coming from Wall Street’s largest retailers like Walmart and Target, some investors are bracing for the worst. At the very least, it is likely the economy is entering a period of stagflation, where interest rates are rising and there is little economic growth. This type of economy is something the U.S. has not seen since the 1970s but has occurred due to the combination of unusual circumstances that included the impact of COVID-19, low-interest rates, and the Russian war in Ukraine.
The Federal Reserve is the independent government agency, responsible for maintaining full economic employment and price stability. The May nonfarm payrolls report showed the U.S. created 390,000 jobs, exceeding consensus estimates of 325,000. Current unemployment remained at just 3.6%, so the Fed is remaining laser-focused on fighting inflation in the U.S. The latest May CPI annual report showed an increase of 8.6% year-over-year, making it the highest reading for this index since 1981. The headline CPI results were driven by nearly a 35% increase in energy prices and 10% in food costs. The positive news is that core inflation, which removes these two categories, decelerated to a 6% increase in May year-over-year, signaling that some components of inflation could be trending down.
The Fed is tasked with providing the U.S. economy with a “soft landing,” attempting to reduce inflation while not stifling economic growth. Fed Chair Jerome Powell referred to 1965, 1984, and 1994 as years where the committee previously accomplished this. The Fed is increasing interest rates over what is expected to be the foreseeable future. This is causing demand for big-ticket purchases like single-family homes to slow, as the cost to borrow money becomes more expensive. Mortgage demand has reached a 22-year low after this year’s rate hikes.

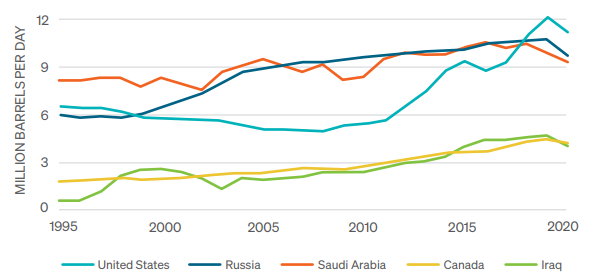
As developed nations continue the implementation of banning the purchase of Russian oil, global demand continues to exceed the available supply. This is continuing the streak of record-high gasoline prices. According to AAA, the U.S. national average for the cost of regular unleaded gasoline at the pump was $4.62/gallon at the end of May. Expectations are that the national average for the price of regular gas unleaded may exceed $6/gallon by the end of summer.
The views expressed herein are exclusively those of Meeder Investment Management, Inc., are not offered as investment advice, and should not be construed as a recommendation regarding the suitability of any investment product or strategy for an individual’s particular needs. Investment in securities entails risk, including loss of principal. Asset allocation and diversification do not assure a profit or protect against loss. There can be no assurance that any investment strategy will achieve its objectives, generate positive returns, or avoid losses.
Commentary offered for informational and educational purposes only. Opinions and forecasts regarding markets, securities, products, portfolios, or holdings are given as of the date provided and are subject to change at any time. No offer to sell, solicitation, or recommendation of any security or investment product is intended. Certain information and data has been supplied by unaffiliated third parties as indicated. Although Meeder believes the information is reliable, it cannot warrant the accuracy, timeliness or suitability of the information or materials offered by third parties.
Investment advisory services provided by Meeder Asset Management, Inc.
©2022 Meeder Investment Management, Inc.
0116-MAM-6/13/22-13399
