You are now leaving Meeder Investment Management. Links to other websites are provided for your convenience and information only. When you click on a link to another website you will be leaving this website. The fact that Meeder Investment Management provides links to other websites does not mean that we endorse, authorize or sponsor the linked website, or that we are affiliated with that website’s owners or sponsors. This material is being provided for informational purposes only and is not a solicitation or an offer to buy any security or to participate in any planning or investment strategy. Unless otherwise indicated, the linked sites are not under our control and we are not responsible for and assume no liability for the content or presentation of any linked site or any link contained in a linked site, or any changes or updates to such sites. We make no representations about the accuracy or completeness of the information contained in any linked sites and their privacy and security policies may differ from ours. We recommend that you review this third-party’s policies and terms carefully.
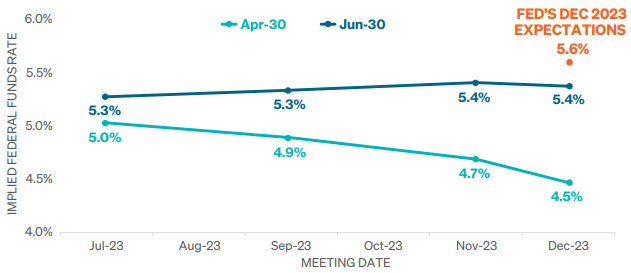
» Investors expect rate cuts before the end of the year, while the Fed anticipates no cuts until 2024.
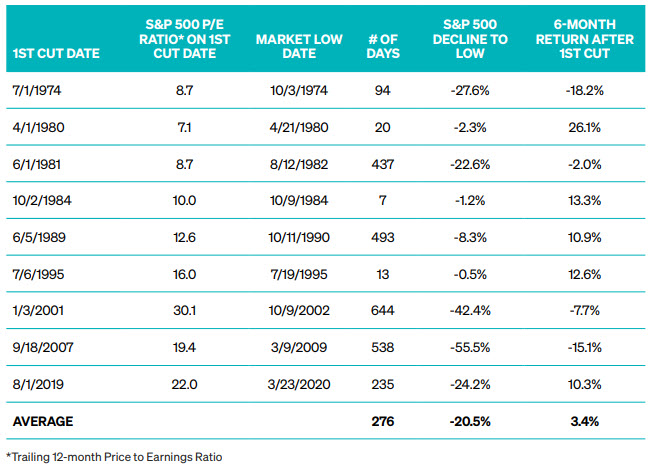
» Many investors believe the stock market will perform well after the Fed starts cutting interest rates. History tells us this is not necessarily true. Since 1970, more than half of the Fed’s first cuts were followed by declines of more than -20% by the S&P 500 Index.
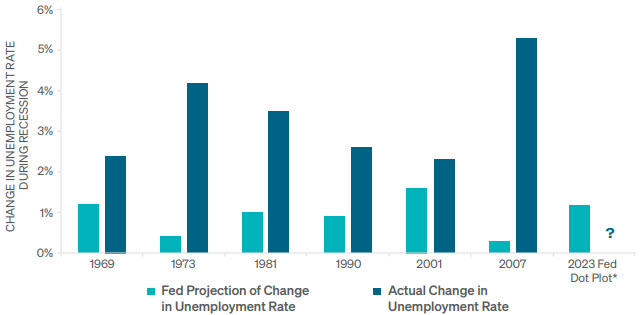
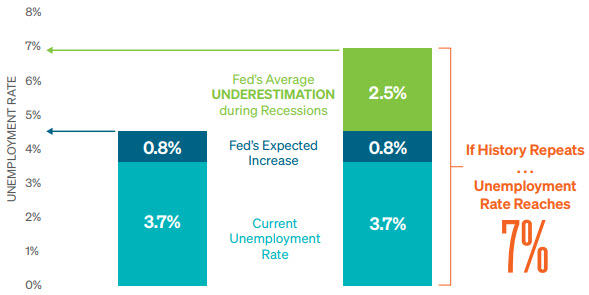
» Soft landings are easier said than done. Historically during recessions, the Fed underestimates the increase in unemployment by 2.5%.

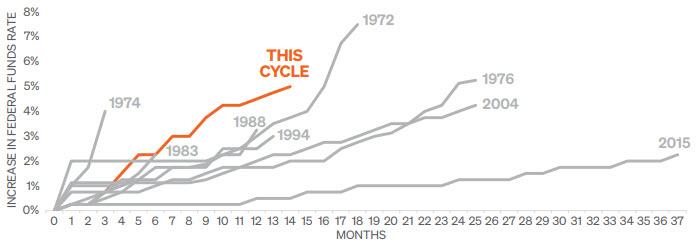
These events caused the Fed to aggressively increase interest rates over the past 14 months. From March 2022 through May 2023, the Fed implemented ten interest rate hikes, taking the Federal Funds rate from near zero to a range of 5.00%-5.25%, making it the second quickest monetary tightening cycle in recent history. (Exhibit 1). Rapidly increasing short-term interest rates created a higher cost of capital, aimed at slowing the U.S. economy and curbing inflation.
Valuations matter too. When the market had a decline of at least -20% after the Fed’s first cut, the average S&P 500 trailing PE ratio was 18. On the other hand, when the S&P 500 had a decline of less than -10%, the average PE ratio was 11.4. The current P/E ratio of 22 could be another reason to be more cautious once the Fed makes its first cut.
As of June 2023 the current unemployment rate is 3.6%. According to the Fed’s dot plot, the FOMC anticipates unemployment will rise to 4.5% during this period of economic slowing. As shown in Exhibit 5, since 1969, the Fed has consistently underestimated the increase in unemployment during recessions by an average of 2.5% each cycle. If the Fed’s average underestimation holds true, that means that the unemployment rate would rise to 7% during this period of economic slowing.
As the famous quote often attributed to Mark Twain states, “History doesn’t repeat itself, but it often rhymes.”
Investment advisory services provided by Meeder Advisory Services, Inc., Meeder Asset Management, Inc., and/or Meeder Public Funds, Inc.
©2023 Meeder Investment Management, Inc.
1001-MAM-MAS-MPF-7/12/23-34249