May 2024
April 2024: Capital Markets Commentary
» The Federal Reserve
» U.S. Economy
» Market Performance
» Labor Markets
» U.S. Economy
» Market Performance
» Labor Markets

Key Takeaways
The Federal Reserve
The Federal Reserve remains cautious about cutting interest rates due to a resilient labor market and strong U.S. economy. Despite the Fed’s restrictive monetary policy, inflation remains stickier than it would prefer. At their most recent meeting, these concerns were the primary reason the Federal Reserve held short-term interest rates at a range of 5.25% to 5.50%. Powell stated, “We didn’t see progress in the first quarter and I’ve said that it appears then that it’s going to take longer for us to reach that point of confidence, so I don’t know how long it’ll take. I can just say that when we get that confidence, then rate cuts will be in scope and I don’t know exactly when that will be.”
Recently, some weaker-than-expected economic indicators have led investors to speculate that this may help inflation trend downward in the coming months. Could this weaker economic data sway the Federal Reserve’s future decision and increase the likelihood of rate cuts to stimulate economic growth?
Recently, some weaker-than-expected economic indicators have led investors to speculate that this may help inflation trend downward in the coming months. Could this weaker economic data sway the Federal Reserve’s future decision and increase the likelihood of rate cuts to stimulate economic growth?
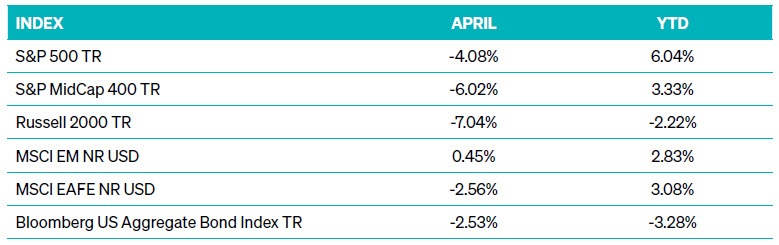
Market Performance
After weaker-than-anticipated economic data releases, April marked the worst-performing month of 2024 for many of the market’s major indices. Major equity indices posted mixed results, with the S&P 500 and S&P MidCap 400 registering declines of -4.0% and -6.0%, respectively, while the Russell 2000 saw a more pronounced drop of -7.0%. Developed international markets ex-U.S. (MSCI EAFE) also experienced volatility during the month, while emerging markets (MSCI EM) demonstrated resilience and posted modest gains.
U.S. Economy
The U.S. GDP for the first quarter fell substantially short of the +2.5% level that investors expected by expanding by +1.6%. This level marked a significant deceleration from the previous quarterly growth rate of +3.4%. Additionally, the ISM Manufacturing and Services Purchasing Managers’ Index (PMI) both signaled a slowdown in economic activity, with readings falling below the critical threshold of 50, indicating contraction.
The Leading Economic Index is designed to identify turning points in the business cycle. February 2024 marked the first positive monthly index result since April 2022. However, March’s data, released in mid-April, reversed this trend, falling by 0.3. With only one positive month since April 2022, the near-term economic outlook remains uncertain.
The Leading Economic Index is designed to identify turning points in the business cycle. February 2024 marked the first positive monthly index result since April 2022. However, March’s data, released in mid-April, reversed this trend, falling by 0.3. With only one positive month since April 2022, the near-term economic outlook remains uncertain.
Labor Markets
The U.S. labor market remains strong but showed signs of some slowing last month. The April U.S. Non- Farm Payrolls report revealed the addition of 175,000 jobs but fell short of the consensus estimate of 300,000. April’s jobs represented the lowest monthly job gain in the past six months, yet it marked the 40th consecutive month of positive employment growth. The unemployment rate increased to 3.9% from March’s 3.8%. A level of 3.9% or higher has not occurred since January 2022.
CIVILIAN UNEMPLOYMENT RATE, SEASONALLY ADJUSTED
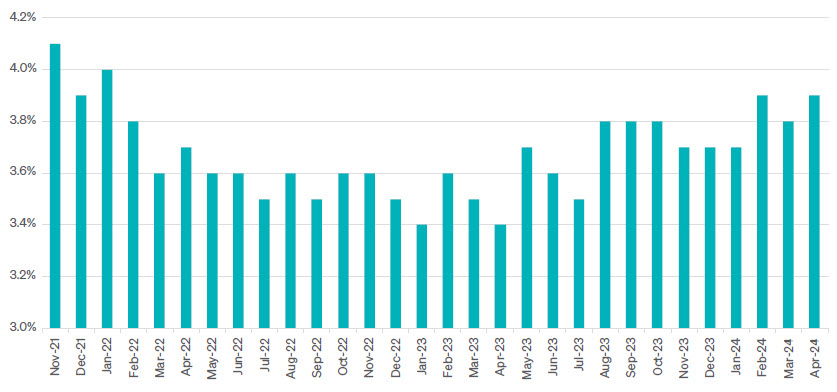
SOURCE: BUREAU OF LABOR STATISTICS
As we navigate these shifting economic conditions, it’s essential to maintain a diversified investment approach tailored to your long-term financial goals. While uncertainties persist, proactive portfolio management and a focus on quality investments can help mitigate risk and capitalize on opportunities as they arise. While weak recent economic data may have raised concerns, we can navigate through periods of uncertainty with confidence and clarity by staying informed and maintaining a disciplined investment strategy.
The views expressed herein are exclusively those of Meeder Investment Management, Inc., are not offered as investment advice, and should not be construed as a recommendation regarding the suitability of any investment product or strategy for an individual’s particular needs. Investment in securities entails risk, including loss of principal. Asset allocation and diversification do not assure a profit or protect against loss. There can be no assurance that any investment strategy will achieve its objectives, generate positive returns, or avoid losses.
Commentary offered for informational and educational purposes only. Opinions and forecasts regarding markets, securities, products, portfolios, or holdings are given as of the date provided and are subject to change at any time. No offer to sell, solicitation, or recommendation of any security or investment product is intended. Certain information and data has been supplied by unaffiliated third parties as indicated. Although Meeder believes the information is reliable, it cannot warrant the accuracy, timeliness or suitability of the information or materials offered by third parties.
Investment advisory services provided by Meeder Asset Management, Inc.
INDEX DESCRIPTIONS
S&P 500 Index: The Index tracks the stock performance of 500 of the largest companies listed on stock exchanges in the United States. It is one of the most followed equity indices and includes approximately 80% of the total market capitalization of U.S. public companies.
S&P 400 MidCap Index: The Index serves as a gauge for the U.S. mid-cap equities sector and is the most widely followed mid-cap index. To be included in the index, a stock must have a total market capitalization that ranges from $5.8 billion to $15.8 billion.
Russell 2000 Index: The Index is constructed to provide a comprehensive, unbiased barometer of the small-cap segment of the US equity market. A subset of the Russell 3000 Index, it includes approximately 2,000 of the smallest securities based on a combination of their market cap and current index membership.
MSCI EAFE Index: The Index is an equity index that captures large and mid-cap representation across 21 Developed Markets countries* around the world, excluding the US and Canada. With 783 constituents, the index covers approximately 85% of the free float-adjusted market capitalization in each country.
MSCI EM Index: The Index captures large and mid-cap representation across 24 Emerging Markets (EM) countries*. With 1,440 constituents, the index covers approximately 85% of the free float-adjusted market capitalization in each country.
Bloomberg US Aggregate Bond Index: The Index is a broad-based flagship benchmark that measures the investment-grade, US dollar denominated, fixed-rate taxable bond market. The index includes Treasuries, government-related and corporate securities, fixed-rate agency MBS, ABS, and CMBS (agency and non-agency). Provided the necessary inclusion rules are met, US Aggregate-eligible securities also contribute to the multi-currency Global Aggregate Index and the US Universal Index. The US Aggregate Index was created in 1986, with history backfilled to January 1, 1976.
©2024 Meeder Investment Management, Inc.
0116-MAM-5/14/24-42569