April 2024
Q1 2024 Quarterly Perspectives

Key Takeaways
MARKET PERFORMANCE UPDATE
U.S. equity markets started the year in negative territory, but the S&P 500 later rebounded to achieve multiple record closes, ultimately closing the month with a modest gain of +1.7%. Market sentiment was positive with the anticipation of the Fed achieving a soft-landing scenario and the release of robust economic data, highlighted by a Q4 annualized GDP print of 3.3%.
Despite expectations of imminent rate cuts, Federal Reserve Chair Jerome Powell emphasized needing additional evidence indicating a stabilization of inflation before contemplating any policy easing, thereby contributing to an increase in volatility of U.S. Treasuries. Abroad, concerns surrounding China’s economic performance acted as a drag on the Emerging Markets index, which concluded the month down -4.6%. Meanwhile, the 10-year U.S. Treasury yield saw a slight uptick, climbing from 3.9% to 4%, consequently nudging U.S. investment-grade bonds into negative territory.
February showcased the resilience of U.S. equity markets, with the S&P 500 delivering an impressive surge of +5.34%. Smaller market caps represented by the S&P MidCap 400 Index and the Russell 2000 Index also demonstrated positive momentum. This improvement helped equity markets extend the rally with increasing market breadth.
Fixed-income investments faced significant headwinds. The Bloomberg US Aggregate Bond Total Return Index suffered a decline of -1.41% in February. This downward trajectory was attributed to persistent upward pressure on interest rates and lingering concerns surrounding inflation. On the global front, emerging market equities exhibited signs of improvement, while developed international stocks posted relatively modest gains, underscoring the contrasting performance between domestic and international equities.
March provided mixed economic data, presenting investors with a blurred picture of the economic landscape. The ISM Manufacturing PMI provided hope by surpassing consensus estimates to reach 50.3, marking the first monthly expansion since September 2022. The S&P 500 surged to a new closing high, reaching 5264 by the end of the first quarter. The S&P 500 extended its quarterly gains to +10.5% as eight of eleven sectors were positive.
Data for Leading economic indicators, as measured by the Conference Board Leading Economic Index (Exhibit 1), climbed higher for the first time since February 2022. Investors welcomed this positive news because the LEI provides early signals of economic turning points in the U.S. business cycle.
EXHIBIT 1: U.S. LEI RISES FOR FIRST TIME SINCE 2022 | THE CONFERENCE BOARD LEADING ECONOMIC INDEX (LEI) MOM CHANGE
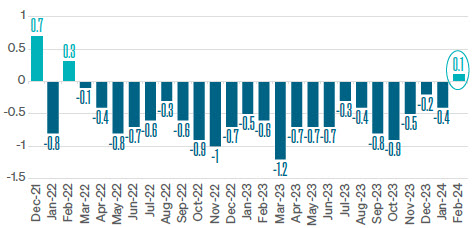
SOURCE: BLOOMBERG
Inflation data for February were released at the end of March. The Fed’s preferred measure of inflation, PCE (Exhibit 2), has trended down but is at a slower pace than the Fed would prefer. Recent data shows that food and energy prices remain stubbornly elevated.
EXHIBIT 2: PCE PRICE INDEX | ANNUAL CHANGE
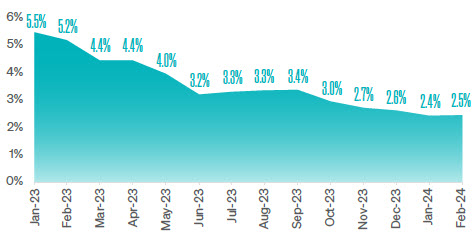
SOURCE: BUREAU OF ECONOMIC ANALYSIS
The U.S. labor market remains solid, and Non-farm payrolls exceeded market expectations in March by adding 303,000 jobs compared to expectations of 200,000 (Exhibit 3). This consistent growth contributed to U.S. unemployment trending lower in March from 3.9% to 3.8%.
EXHIBIT 3: U.S. LABOR MARKET SURGES WITH 303,000 JOBS IN MARCH | U.S. EMPLOYEES ON NON-FARM PAYROLLS TOTAL MOM CHANGE
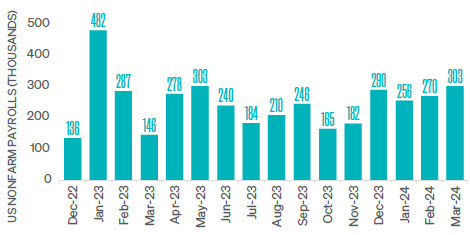
SOURCE: BLOOMBERG, BUREAU OF LABOR STATISTICS
This economic strength, continued market gains, and higher-than-expected inflation led the Federal Reserve to maintain short-term interest rates at 5.5% for its fifth consecutive meeting. Federal Reserve Chair Jerome Powell reiterated that the committee will need more evidence that inflation is subsiding before cutting interest rates. Minutes of the FOMC March meeting provided further insight that the Fed is now only anticipating three interest rate cuts in 2024. This is a dramatic shift because, according to CME FedWatch, at the end of 2023, investors were pricing in an 82% likelihood of 6 or more rate cuts in 2024.
HOW IS THIS IMPACTING PORTFOLIOS?
Meeder manages investment strategies that utilize a multidiscipline and multi-factor investment approach that guides us in allocating our portfolios. We manage investment solutions across an array of risk profiles and time horizons. Many of these solutions employ one or more of our core investment strategies: Growth, Defensive Equity, and Fixed Income.
GROWTH STRATEGY
Investment portfolios utilizing the Meeder Growth Strategy maintain a more aggressive objective and typically remain invested in the stock market.
In the first quarter of the year, the market’s upward momentum from the end of 2023 persisted, with the S&P 500 Index reaching multiple record highs and delivering a robust return of +10.5%. The market rally broadened as mid-cap stocks represented by the S&P 400 Index grew nearly 10%. This contribution helped 8 of 11 S&P sectors post positive performance. Investors in portfolios utilizing the Meeder Growth Strategy experienced increased volatility than some of the others in our suite of risk-based portfolios, however, those who remained invested earned the highest investment performance.
In the first quarter of the year, the market’s upward momentum from the end of 2023 persisted, with the S&P 500 Index reaching multiple record highs and delivering a robust return of +10.5%. The market rally broadened as mid-cap stocks represented by the S&P 400 Index grew nearly 10%. This contribution helped 8 of 11 S&P sectors post positive performance. Investors in portfolios utilizing the Meeder Growth Strategy experienced increased volatility than some of the others in our suite of risk-based portfolios, however, those who remained invested earned the highest investment performance.
DEFENSIVE EQUITY STRATEGY
Portfolios that utilize the Meeder Defensive Equity Strategy follow a quantitative rules-based and data-driven approach using the Meeder Investment Positioning System (IPS) model. This investment model analyzes the risk relative to the reward present in the marketplace and identifies when we should increase or decrease the portfolio’s target equity exposure.
The Meeder Investment Positioning System (IPS) model, began the quarter with a 95% allocation to stocks. Riding the momentum of a strong market finish in 2023, all ten trend and momentum indicators within the short-term model were positive. As January progressed, discussions of a “soft landing” for the U.S. economy bolstered optimism in the intermediate-term model, despite expectations of a slowing economy in 2024. By January’s end, investor optimism remained profound, which we view from a contrarian perspective. The short-term model reflected strong trends and momentum, against the backdrop of above-average valuations and elevated interest rates that weighed on the long-term model score.
In February, as market breadth waned, the short-term model retained positivity, while expectations of multiple Fed rate cuts in 2024 prevailed. A combination of strong longer-term market trends and improvement in industry-level market breadth led to the long-term model’s most positive reading in nearly 2 years. Bullish market sentiment weighed on the intermediate-term model score, from a contrarian perspective.
By March, the market reached new highs and the short-term model maintained its positive strength. The intermediate-term model score improved as bearish options activity increased following a reversal in investor sentiment. The quarter concluded with the short-term model showing strength. The intermediate-term model reflected positive expectations around Fed rate cuts, and the long-term model remained neutral due to lingering concerns over elevated valuations leading us to end the quarter with 96% exposure to stocks.
FIXED INCOME STRATEGY
The Meeder Fixed Income Strategy tactically shifts portfolio exposure utilizing our proprietary investment models. These models actively monitor economic and market-related factors to guide us in determining the credit quality, emerging market debt exposure, and the portfolio’s duration. The Strategy navigated financial markets with agility and precision during the first quarter of 2024. In January, we maintained an overweight position in U.S. high-yield fixed income to capitalize on the favorable yield relative to investment-grade securities alongside minimal credit risk and robust momentum. Additionally, the Strategy favored emerging market debt due to weakness in the U.S. dollar and positive price momentum. However, as the month progressed and the U.S. dollar strengthened, we reduced our allocation to a neutral position in emerging market debt while maintaining our overweight in U.S. high-yield bonds. Throughout these shifts, we carefully managed the Strategy’s duration, aligning it slightly shorter than the benchmark, particularly in response to fluctuations in the ten-year U.S. Treasury yield.
As February unfolded, we continued to capitalize on the prevailing market conditions. Amid expectations of delayed Federal Reserve rate cuts and robust economic growth, we maintained our overweight position in U.S. high-yield bonds, capturing the attractive yield premium and capitalizing on the potential for substantial economic growth. The Strategy adjusted its duration to lower than the benchmark, anticipating shifts in interest rate expectations. We remained neutral on our emerging market debt allocation but made incremental adjustments to its exposure in response to evolving volatility, currency dynamics, and market momentum.
In March, the Fed provided additional guidance and pushed rate cut expectations further into the future. Volatility declined in emerging market debt and price momentum increased. Therefore, we increased exposure to emerging market debt while maintaining its overweight stance on U.S. high-yield. These adjustments highlighted the Strategy’s flexibility to capitalize on near-term opportunities while navigating evolving macroeconomic market dynamics. We remained vigilant in managing its duration, ensuring alignment with market expectations, and preserving its risk profile amidst changing interest rate scenarios. Overall, the shifts throughout the first quarter of 2024 demonstrate the Meeder Fixed Income Strategy’s adaptability and commitment to optimizing portfolio performance in dynamic market environments.
Commentary offered for informational and educational purposes only. Opinions and forecasts regarding markets, securities, products, portfolios or holdings are given as of the date provided and are subject to change at any time. No offer to sell, solicitation, or recommendation of any security or investment product is intended. Certain information and data has been supplied by unaffiliated third-parties as indicated. Although Meeder believes the information is reliable, it cannot warrant the accuracy, timeliness or suitability of the information or materials offered by third-parties. Advisory services provided by Meeder Asset Management, Inc. and/or Meeder Advisory Services, Inc. Meeder Funds are distributed by Meeder Distribution Services, Inc., member FINRA.
©2024 Meeder Investment Management, Inc.
0107-MIM-4/15/24-41950

©2024 Meeder Investment Management, Inc.
0107-MIM-4/15/24-41950